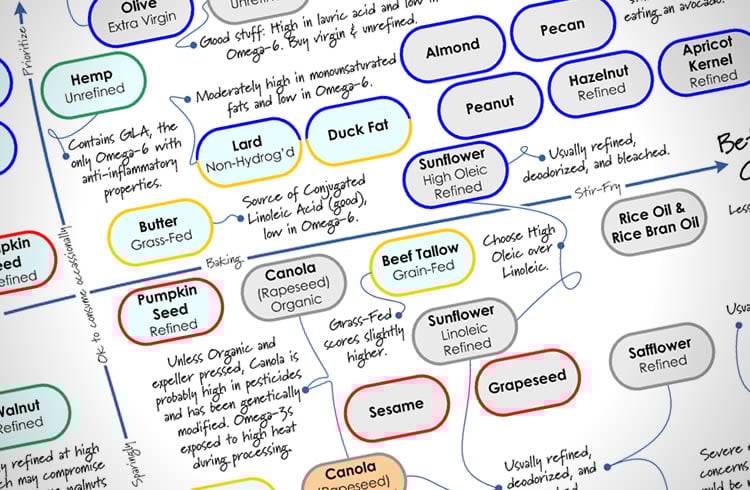
The Cooking Oil Comparison Chart
Last Updated June 28, 2020 · First Published February 13, 2012

You already know that Extra Virgin Olive Oil is good for you. But what do you choose when it’s time to branch out and try something new? There are a lot of cooking oils out there, and many have misleading health claims on the label. It can be a bit overwhelming when you walk down the oil aisle in the store.
Some oils are very healthful, others not so much — and for different reasons. How do you know what’s really important when choosing a cooking oil? And how do you keep track of them all?
Why, with The Cooking Oil Comparison Chart, of course!
I’ve teamed up with Andy Bellatti, MS, RD, to help answer these questions with this chart. (If you don’t already follow Andy, you’re missing out.) We’ve created a one-page, printable PDF that you can take with you to the grocery story (or stick up on your fridge), that will help guide you through the labyrinth of oils.
We focused on two main factors, healthfulness and temperature-sensitivity, since some oils lose their health benefits when heated. Using a grid that makes it easy to see where each oil falls on the spectrum, you’ll be able to tell at a glance which oils to use for your salad, and which to use for your next stir-fry — and which oils to avoid altogether. We’ve also included some secondary details about each oil, along with some important pitfalls to watch out for.
Andy has written a post on his blog explaining the science behind our oil comparisons, so you’ll know why each oil is where it is on the chart. So click on over to Andy’s post to get the nitty-gritty, and then come back here and get the PDF.
The Cooking Oil Comparison Chart
792kb PDF, Last updated June 20, 2017
—
If you’d like to share this chart on your own website or blog, please be respectful (and law-abiding) and share it simply by linking directly to this post. Please do not link directly to the PDF or copy the entire chart to your own site. You may use the image at the top of this post on your own page, if you like. Thanks!
—
PS – Huge thanks to Andy for jumping on board when I proposed this project to him. I had a ton of fun collaborating with him, and appreciate his enthusiasm and expertise!
—
You may also like my other printables:
The Healthy Breakfast Flowchart
The Smoothie Flowchart
A Guide to the My Plate Icon
How to Read the Nutrition Facts Panel


Great reference chart! Need to link in Chia and Inca Inchi oil
I’m curious what type of olive oil is on the chart and where the other olive oil types would appear.
Notably
* Extra-Virgin Olive Oil
* Virgin Olive Oil
* Refined Olive Oil
There are often some other classifications like “Pure” olive oil that are blends, but it seems to mainly break down into those three categories where it seems possible to make blanket statements about the oil.
Hello telemenar,
I live in Greece, we produce end export tones of olive oil. The best is the extra-virgin oil. It’s the purest because it’s has been subjected to less processing. Of course if you heat the virgin extra oil, you have less benefits.
Hi There,
I love Andy’s site and frequently go there for information. But, I have a few concerns with this chart:
1. Soybean oil – if bought organic, this has a 7.1:1 omega 6:3 ratio…wouldn’t this be considered a better choice?
2. Sunflower oil – has a 39.4:1 omega 6:3 ratio…wouldn’t you want to limit this oil?
Thanks for your help!
Selena
Great post. Thanks for sharing and love the chart. It’s so clear and user friendly. Looking forward to exploring more on your blog.
I use your chart often and have referred friends to it, as well, but I just recently read elsewhere that safflower oil was not a good choice due to being very high in Omega 6s, so now I am confused! Any clarification would be appreciated – thank you!!
Andrew, I really enjoyed this and especially enjoyed the “discussion” that followed. Thanks for taking the time to plot these on a chart. i know it takes a lot of time and thought and you know i’m a sucker for your cool charts. 🙂 may i ask where you might put ghee on this chart? If you end up modifying this chart to include it, let me know…i want to put it on my parents’ fridge!! 🙂
Dear Sir,
I am vegeterian,
I would like to know how to balance the ratio of OMEGA-6 AND OMEGA 3 by planning out consumption of cooking oil.
I am consuming SUnflower oil and peanut oil.
Suggest me if i need to consum content of other oil, as well suggest its application/ intake.
Hope i am not confusing.
Cooking oils are not a good way to boost your Omega-3 intake, since the heat degrades the oil. The oils on the left side of the chart that have a green border are higher in Omega-3, so if you want to increase your Omega-3 intake, focus on those. Use them in salad dressing (don’t cook with them). Hope that helps!
Your Cooking Oil Comparison chart shows hydrogenated margarine but not non-hydrogenated. Thanks sharing informaiton.
It wasn’t practical to include non-hydrogenated margarines, since there are many different brands, and they each have their own specific recipe. They’re usually made up of several other oils that are shown on the chart, so you’ll need to read the ingredients and consider each oil. (Though they’re not usually oils that we put at the top of our chart!)
Personally, I would stay away from rice bran oil. A recent informative article in Consumer Report’s magazine talks about the high levels of arsenic in rice, especially brown rice. According to the article, the bran holds most of the arsenic. For years I’ve been eating brown rice products thinking it was healthy. Now this report! What is happening with our food supply!
I am past 80 — I am in good health — I weigh the same as I did when I was in the Air Force 60 years ago — I eat most everything –I JUST DON’T EAT TO MUCH OF ANYTHING /////